
Maximize Profit
Identify buying and selling signals using chart tools. Add portfolio position and track your profit / loss.
Don't forget that trend is your friend.

World Stocks & FX
Track stocks from world stock exchanges along with currency pairs (FX).

Need Help?
If you have any problems or suggestions do not hesitate to contact us. Any feedback from you is beneficial for us.
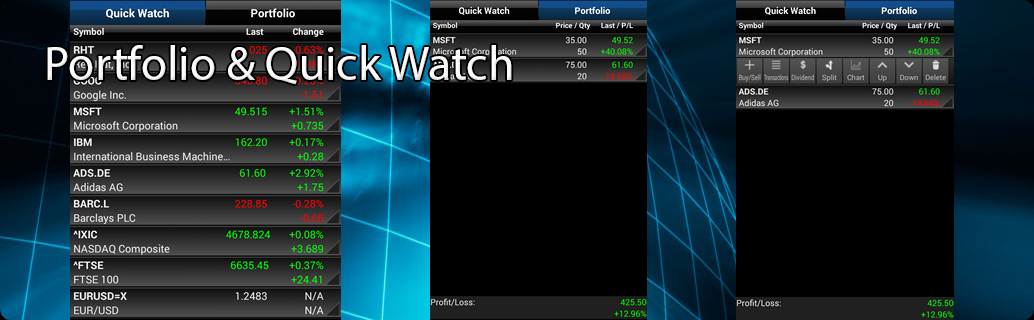
Quick watch
On the application main screen you can choose symbol to display. Most of world stock exchanges are supported including currency pairs (FX). Track changes of your favorite stocks and be prepared to trade in a timely manner.
Portfolio
Add your opened positions to portfolio screen so you can track your profit in the real time. You can add new transactions to already opened positions, add dividends or apply splits.
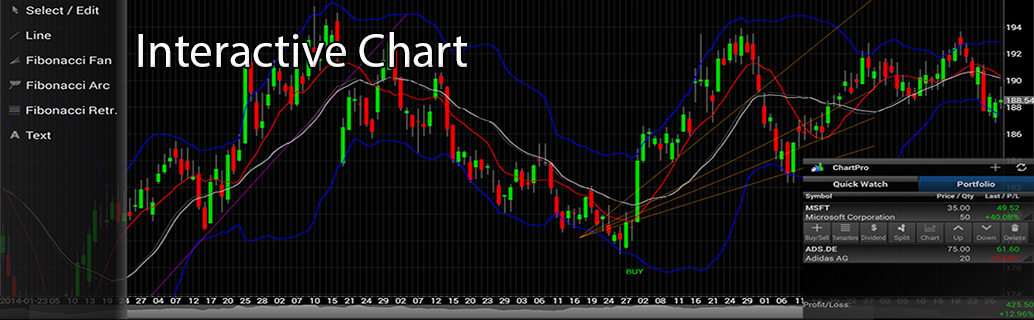
Interactive Chart
Turn your mobile device into powerful technical analysis tool using interactive chart. Chart provides all the tools that you need of technical analysis: different chart types, intraday support, scrolling, pinch to zoom, crosshair cursor, offline mode.
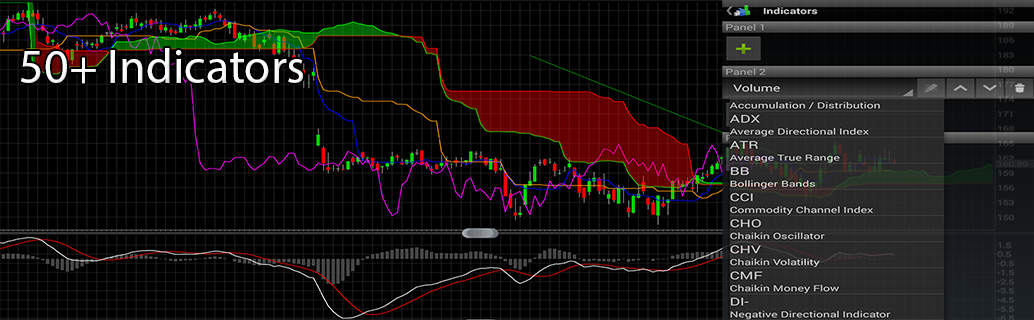
Indicators
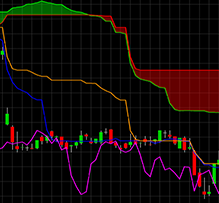
Professional stock chart contains more than 50 indicators which can help you make right decision. See here complete list of supported indicators.
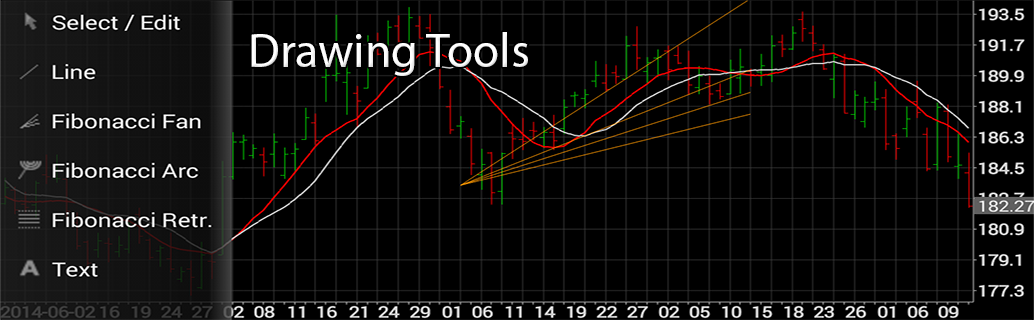
Drawing tools
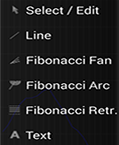
Use integrated chart drawing tools to analyze price movement. Identify trend and trade in trend to maximize your profit. Use Fibonacci drawing tools to identify retracements, support and resistance lines and trend reversals.
News
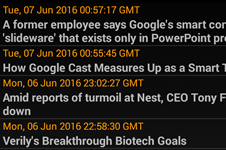
Stay informed about latest news for company (ticker) that you are analyzing. That way you can do both technical and fundamental analysis. Application uses Yahoo news as data source.
Alerts
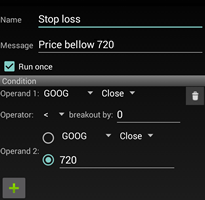
Alerts give you ability to define some custom conditions and when those conditions are met you will be informed with notification. Define some conditions like stop loss or indicator crossovers and let application inform you immediately so you can execute your trades effectively.
Alerts run in background even if application is not started. So you do not need to constantly run application to monitor prices, when defined condition is met you will be immediately notified.
Automatic trend lines
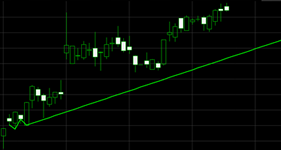
Trend identification is most important step for traders. People like to say: "Trend is your friend". But sometimes it is not easy to spot early trend formation and trend reversals.
Application can automatically analyze historical data and identify trends. Trend lines recognition is implemented as advanced technical indicator, so you can even set alert to get notified if trend is broken.
Candlestick pattern recognition
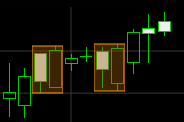
Sometimes candlestick reversal patterns can be early signal of trend reversal. Candlestick reversal patterns are automatically identified and drawn on chart. Pattern recognition is implemented as advanced technical indicator.
Chart themes
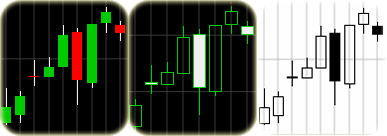
For users that do not like default coloring of chart there are different themes that can be chosen.

Revision history
Company News
Dec.03, 2016
Version 3.4.0.
Premium version, alerts, chart themes, more panels...
Nov.29, 2016
Petanoi Ltd.
Petanoi Ltd is now owner of professional stock chart.
Jun.17, 2016
Version 3.3.0.
Added more features like news, multiple quick watches and portfolios. Improved chart performances, categorized indicator list...
Sep.22, 2012
New WEB site.
Launched new WEB site. You can find now more information about application.
